Easy Inventory Management
Group your corporate emissions factors to build your stats based on time and location
Carbon management has evolved into a complex process requiring proficiency and technical skills. You and your customers deserve a good quality tool faciliating calculations to focus on the analysis and optimisation parts.
Get Started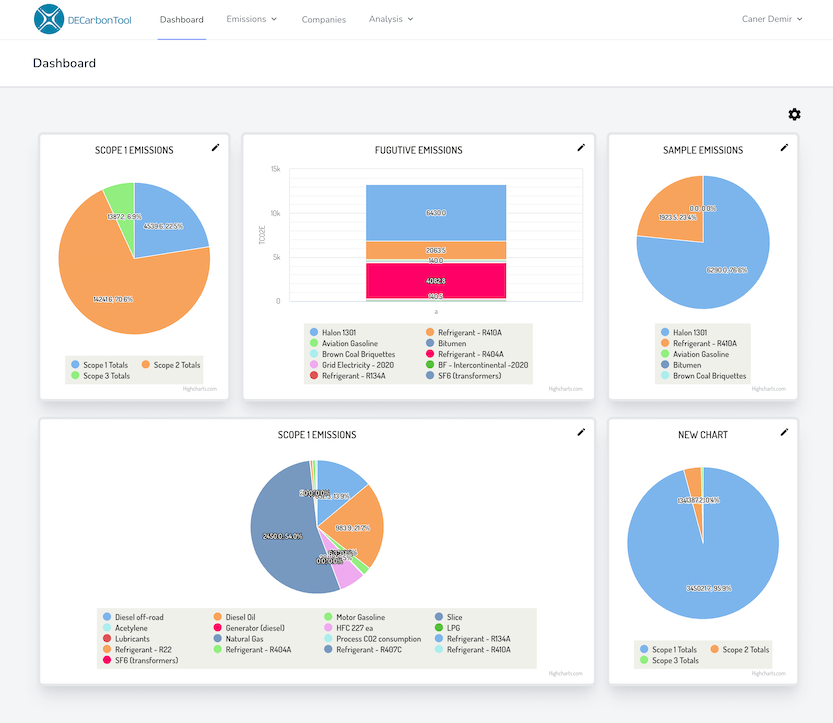
Group your corporate emissions factors to build your stats based on time and location
Emissions and energy consumptions are calculated on the fly as you input data in the dynamic table module
Regroup your data within layers and create striking charts to visualize your company's carbon footprint progress.
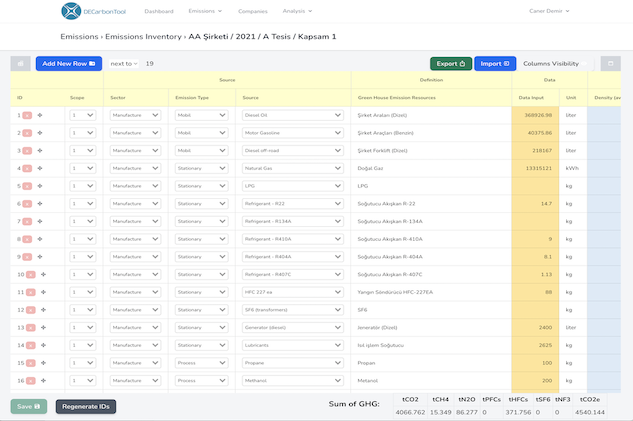


Working with table data is tricky. Doing it within the carbon emissions context is hard too. We make it easy for you. You just input source types with consumption values and our tabular processing engine will automatically calculate emissions and energy output. Your data will be instantanously ready to be represented with beautifully crafted data charts.
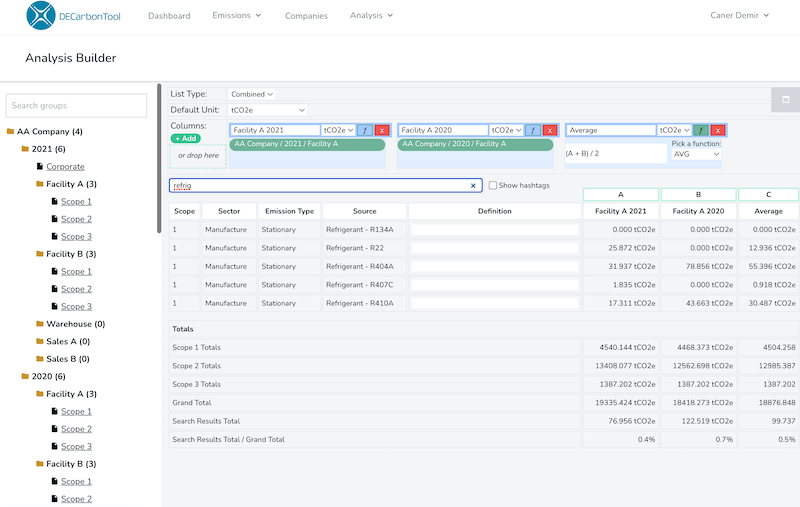
With the help of our advanced analysis builder tool, you can create multiple axis charts indicating emissions and energy consumption comparisons.


You deserve a good quality tool for carbon footprint analysis and optimisation.
Design auditable, transparent, well-documented inventories of Scope 1,2,3 greenhouse gas emissions in accordance with International Standards (ISO 14064-2018 and GHG Protocol).
Collect data from dozens of facilities and warehouses - ensuring data collection directly from suppliers.
It's hard to conceptualize raw data out of numbers without visualization. Make it happen with beautiful charts.
Create your own dashboard to showcase featured charts and tables. Drag and drop placeholders to apply your custom design.
No need to struggle with a long learning curve. Our user interface will help you to discover how the tool works soon after you start using it.
Import your Excel file to an inventory and leave the rest to us. Your data will be instantaneously converted to a dynamic table.
Export your dynamic data to Excel files.
Select up to three charts per sheet, add your notes and voila! Your PDF reports are ready to be saved or printed.
Please contact us at bilgi@demirenerji.com to start your subscription